


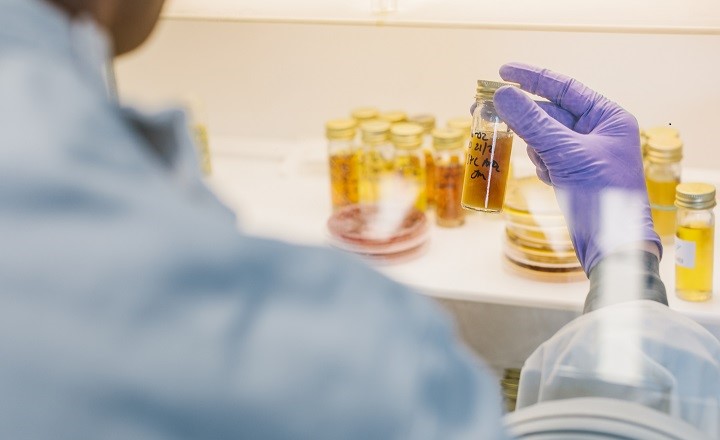
At NCIMB we identify thousands of bacterial and fungal isolates every year – many of them sent to us by quality control microbiologists from the pharmaceutical, food and beverage sectors. Usually these arrive as pure cultures on plates, and we pick off colonies to identify the single species present.
However, sometimes we are faced with more challenging samples, such as slime from inside a bioreactor, or samples collected from natural environments such as soil or sediments.
Within bioreactors, unwanted slimes are generally the result of microbial contamination. There could be one contaminant, or a complex mixed community which has formed a biofilm. Plating out this kind of slime to isolate individual species for identification can be a very time consuming, and ultimately frustrating, process. There is no guarantee that all the species present in mixed environmental samples will grow quickly, or at all, under laboratory conditions. This is particularly the case for samples taken from natural environments, so it can be difficult to know if the strains identified using this approach are giving the full picture.
When faced with these kinds of samples, we now often suggest a 16S metagenomics approach because it provides a fast track to revealing the full make up of complex microbial communities by cutting out the requirement for plating and culturing.
Next generation sequencing
16S metagenomics analysis is undertaken using what is known as next generation sequencing. Next generation sequencing platforms were launched commercially in 2005, and since then costs have decreased substantially, allowing the technology to be used in routine analysis. In practice, the term “next generation sequencing” refers to a number of different technologies that all have one thing in common – they offer a step change in the scale of data that can be produced from a single sequencer. The difference can be illustrated by comparing the throughput of a next generation sequencer with the Sanger sequencers that we use for the more straightforward identification of pure bacterial or fungal cultures. With our current Sanger sequencer, we could sequence just under 50,000 bases in 24 hours. With our next generation sequencer, our smallest run would be 500,000,000 bases in 24 hours – in other words, our smallest NGS run in a 24-hour period would be 10,000 times what we could achieve with a Sanger sequencer. Bases are the units that make up the genetic code, and to put these figures in context we normally sequence 500 base pairs in order to identify bacterial isolates.
Two important applications for next generation sequencing are whole genome sequencing, which can be used for strain-to-strain differentiation and comparison, and 16S metagenomics.
16S metagenomics
As you can probably guess, 16S metagenomics is based on sequencing sections of the same gene as the 16S Sanger sequencing we use for identification of bacterial isolates – the big difference is that the sequencing is undertaken in a massively parallel way. In other words, while with Sanger sequencing we sequence a single DNA fragment at a time, with NGS it is possible to sequence millions of fragments simultaneously in a single run. The different applications of Sanger and NGS are summarised in figure 1.
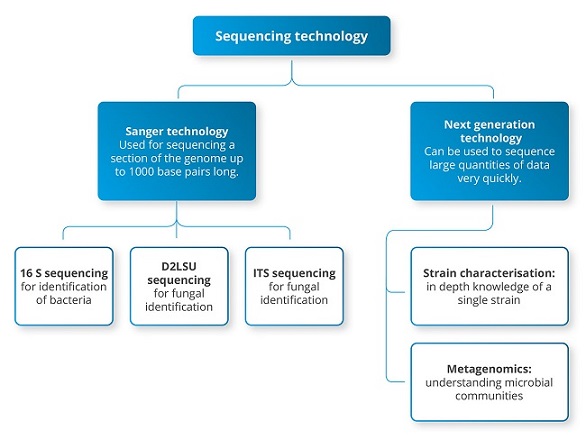
Figure 1: applications of Sanger vs next generation sequencing
The quantities of DNA extracted are often very small, especially from environmental samples. However, similarly to Sanger sequencing, these small quantities of DNA are amplified using PCR to create sufficient amounts of the sequences of interest.
The first round of PCR amplifies the majority of 16S sequences present in the starting material to produce a mixed PCR product that represents the mix of bacterial species in the sample. Each fragment of DNA is subsequently sequenced and analysed independently, allowing us to look at each sequence generated and attach a taxonomic label to it – in other words a species identifier.
This labelling process not only tells us which species are present, but also allows an assessment of the number of times the sequence occurs. In other words, the process can be used, not only to identify the individual species that are present in a complex mixed sample, but also to measure the relative abundance of the species present.
This method can be applied to many different scenarios and gives unparalleled insight into a system under study. For complex samples it is likely to be a more cost-effective approach than isolating and identifying a large number of strains. It can also deliver results for complex samples much more quickly.
Results
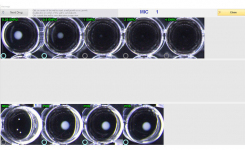
So what do the results of 16S metagenomics analysis actually look like? The results can be viewed as a simple bar chart, illustrated in Figure 2. For each sample there is a breakdown of the organisms present, and the relative abundance of each organism in the sample. This can be very useful when comparing the diversity of different samples. For single complex samples a bar plot can also be useful as a way of visualising the organisms within the sample.
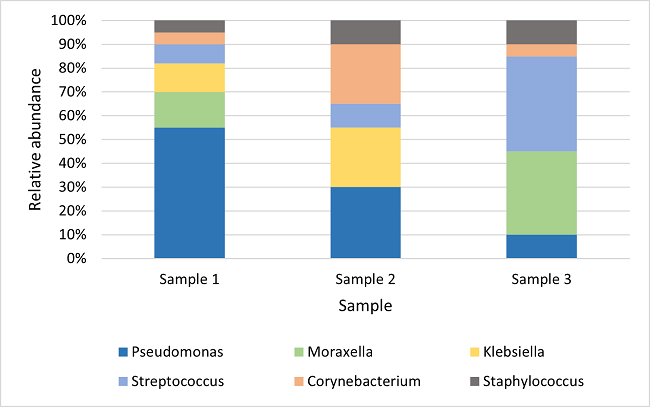
Figure 2: comparing different samples can highlight variation in abundance of genera present as well as any differences in the genera or species identified.
Case study
We received a viscous bacterial suspension from a customer. They wanted to know all the organisms present in the sample, as they believed there were some contaminants as well as the organisms that should have been present. There were two options for this – traditional microbiology followed by Sanger sequencing for identifying isolated strains, or 16s metagenomics directly from the sample.
It was decided to use a 16s metagenomics approach for the following reasons;
- To speed up the process by removing the time it would take to isolate and purify cultures from a range of media types/ growth conditions - the time saved could potentially amount to weeks.
- To ensure as many organisms as possible were identified including those with more complex growth requirements and non-viable organisms. Often it is the organisms with more complex growth requirements e.g. anaerobic or thermophilic organisms, that we are sent by pharma customers for identification, so it is important to also consider them.
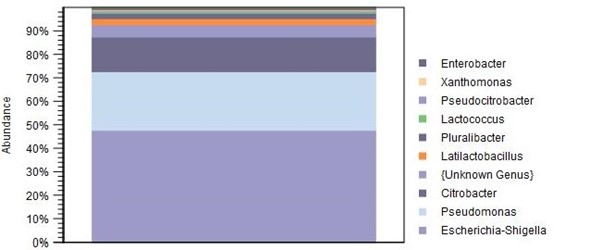
Figure 3: Genus-level results for a single sample
This is how the results were presented for the sample. As well as being able to differentiate between organisms that could be quite difficult to isolate by plating, we were able to obtain a relative abundance of each organism within the mix. These results show that the genus Escherichia-Shigella makes up the largest proportion of the sample (approximately 47%) followed by Pseudomonas (approximately 25%), then Citrobacter (approximately 15%), and so on. Results can be viewed as bar plots at each taxonomic level – for example these are viewed at the genus level, but you may not require this level of detail, or you may require species level to be shown.
Visit NCIMB for more or click on the Request Information button to send an email.