Introduction: Mycoplasma are the smallest free-living organisms. They belong to the bacterial class Mollicutes that are distinguished by their lack of cell wall. For that reason they are unaffected by many commonly antimicrobial agents such as beta-lactam antibiotics. Mycoplasma are widespread contaminants in cell culture. In fact, depending on the laboratory, 10 % to 85 % of cell lines may be contaminated. Due to their extremely basic genomes, mycoplasma live as parasites. They compete with host cells for biosynthetic precursors and nutrients and can alter DNA, RNA and protein synthesis and induce chromosomal alterations. Given their tiny size (~0.3 – 0.8 µm) mycoplasma contamination cannot be visualized with a light microscope. Moreover altered growth rates and morphological changes in infected cell cultures can be minimal or unapparent. Furthermore mycoplasma contaminated products represent a human health risk. All these facts show clearly the high demand of routine mycoplasma detection.
Microsart® ATMP Mycoplasma enables a reliable and sensitive detection of mycoplasma DNA in cell cultures and cell culture derived biologicals, like autologous transplants, according to European Pharmacopeia 2.6.7. Regulations require comparability studies with compendial growth based methods. As PCR technology only detects genome copies (GC), a correlation between colony forming units (CFU) and GC is required by different authorities, i.e. Korean Food and Drug Administration (KFDA) or Pharmaceuticals and Medical Devices Agency PMDA, Japan.
In this study the correlation between CFU and GC of 9 different mycoplasma species was investigated using Sartorius´ quantified CFU and GC standards to facilitate implementation and approval of qPCR-based mycoplasma detection methods.
DNA Extraction of Microsart® Validation Standard Each package of Microsart® Validation Standard contains 3 vials, each containing 10 CFU of the chosen Mycoplasma species. 250 µl Dulbecco’s Modified Eagle Medium (DMEM) + 10 % fetal bovine serum (FBS) were added to two vials to prepare a suspension with a concentration of 40 CFU/ml. 500 µl DMEM +10 % FBS were added to one vial to prepare a suspension with a concentration of 20 CFU/ml. The DNA of the cell suspensions was extracted with Microsart® AMP Extraction kit in duplicates according to the protocol. The eluate was used directly for Microsart® ATMP Mycoplasma qPCR.
Microsart® ATMP Mycoplasma qPCR All lyophilized components were rehydrated. For one reaction 15 µl of Mycoplasma Mix were mixed with 1 µl Internal Control DNA. 15 µl of this mix were added to each PCR tube. Each test was carried out with at least two Non Template Controls (NTC) and samples in duplicate. Therefore 10 µl of sample or NTC were added to the PCR tubes with Master Mix respectively.
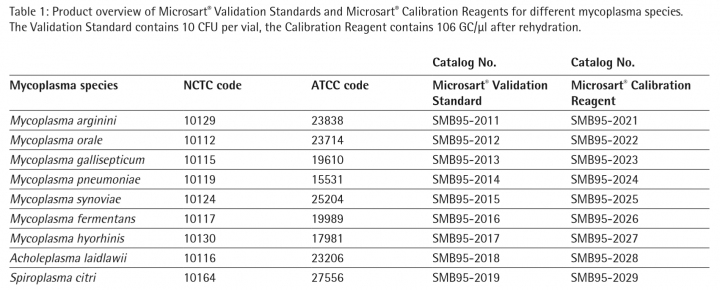
Standard curve with Microsart® Calibration Reagent To quantify the DNA extracts of Microsart® Validation Standards it is necessary to generate a standard curve with known concentrations of genome copies (GC). Therefore Microsart® Calibration Reagents were used. The calibration reagents contain 106 GC/µl of the specific organism after rehydration. Dilution series have been prepared in Tris-buffer to achieve final concentrations of 5 GC/10 µl to 500 GC/10 µl. Microsart® ATMP Mycoplasma qPCR was performed on the CFX96 Touch Cycler (Bio-Rad; 45 cycles, 3 min 95 °C, 30 s 95 °, 30 s 55 °C, 45 s 60 °C). The mycoplasma DNA is indicated by an increasing fluorescence signal in the FAM™ channel. Internal Control DNA is detected in the ROX™ channel in the same tube to indicate a successful reaction in every individual PCR tube. The Analysis of the reaction was done with the CFX Manager Software (Bio-Rad). The limit of detection of all mycoplasma species listed in the EP/USP is ≤ 10 CFU/ml .
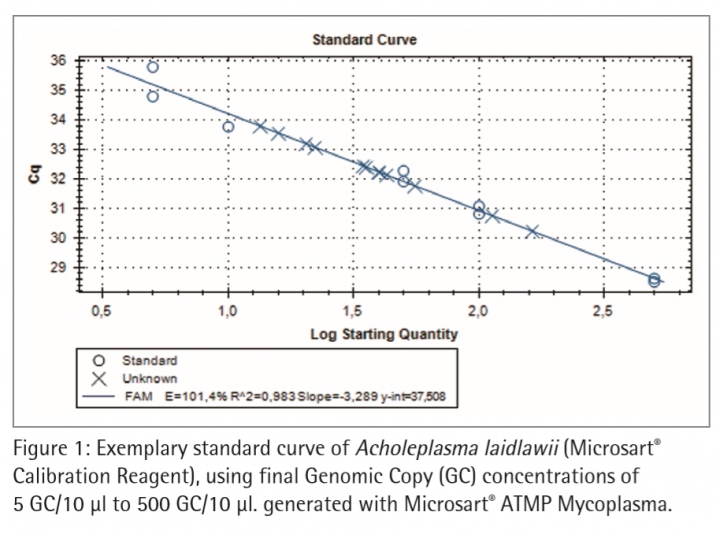
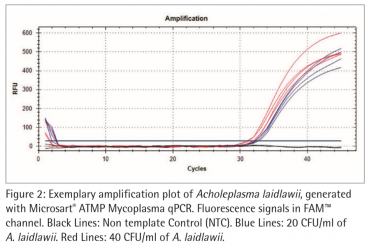
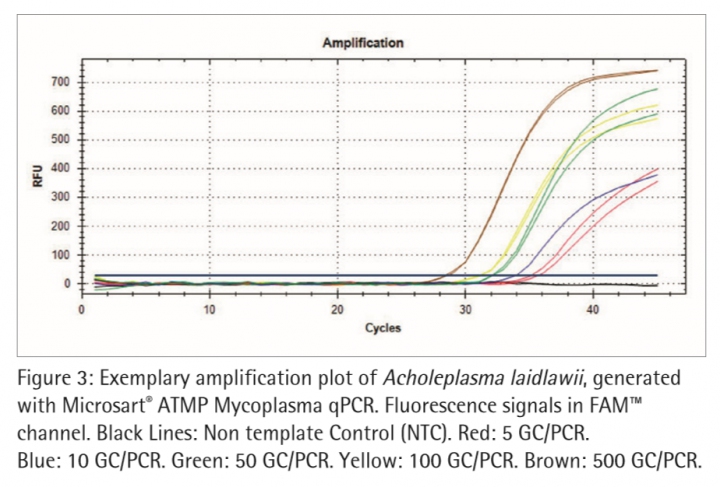
Figure 2 and 3 show exemplary amplification plots of A. laidlawii . On basis of the ct values (FAM™ channel) and concentrations of the standards the CFX Manager software created a standard curve (Fig. 1) with a linear equation. A regression coefficient of 0.983 is an indication for a good standard curve. The efficiency of an optimal qPCR is 100 %. In that case the amplicon DNA will be doubled in each cycle. According to the analysis of the CFX Software the exemplary qPCR run of A. laidlawii ran highly efficient with an efficiency of 101 % (see efficiency in Fig 1).
Each sample and Non-Template Control (NTC) showed an amplification of the internal control DNA and consequently fluorescence signal in the ROX™ channel (Ct<40; data not shown). A successfully PCR without inhibition was indicated. The NTC did not show a fluorescence signal in the FAM™ channel, as expected (see Fig. 2 and 3). Consequently a mycoplasma free preparation of the PCR reactions without cross-contamination was indicated.
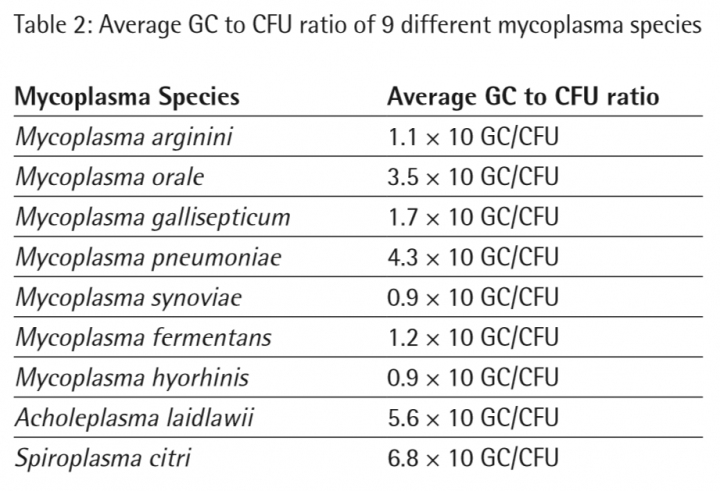
20 CFU/ml and 40 CFU/ml of each mycoplasma species have been detected successfully in all samples (Assay LOD is ≤ 10 CFU/ml; determined during kit validation). Based on the linear equation of the standard curve the software calculated the GC concentrations of the mycoplasma samples (20 CFU/ml and 40 CFU/ml extracts). In table 2 the average GC to CFU ratios of 9 different mycoplasma species are shown.
The study indicated that the GC/CFU ratio varied from species to species and lies within a range of 9 GC/CFU to 68 GC/CFU after DNA extraction.
 Conclusion In this study the correlation between Genomic Copies (GC) and Colony Forming Units (CFU) of 9 different mycoplasma species has been investigated using Sartorius quantified GC and CFU standards. A correlation between CFU and GC is required by different authorities, i.e. Korean Food and Drug Administration (KFDA) or Pharmaceuticals and Medical Devices Agency PMDA, Japan, for assay approval. These results demonstrate a good data basis. Nevertheless it should be kept in mind that significant variations within the GC:CFU ratio might be observed if other media | matrices are used for the CFU spikes which affects the DNA isolation efficiency or other conditions are used for correlation. The results of this study indicate a higher GC than CFU number, as expected. The theoretical GC:CFU ratio should be 1:1, as one GC per cell should ideally be detected. Practically, this ratio is not realizable even if mycoplasma cultures are harvested during early logarithmic growth to prevent detection of DNA from dead cells in the preparation. This non-equal ratio arises because a significant number of the mycoplasma cells would not grow to a colony in culture and remain undetected (i.e. stressed or viable but non-culturable cells). Furthermore mycoplasma cells tend to form agglomerates, which would be detected as 1 CFU, but in fact combine several cells and therefore several GC. Both scenarios lead to a significant underestimation of the realistic Mycoplasma cell number in the sampled cell culture, as only a portion of the cells would grow to form a CFU. Non-culturable species or viable but non-culturable cells could lead to false-negative results using a growth-based method. Undetected Mycoplasma contamination because of false-negative results in growth based methods can result in unsafe products with potential infection risks especially for patients with immunodeficiency. This study shows that the correlation between GC and CFU can successfully be demonstrated and easily be implemented during validation. Furthermore detection of GC by PCR shows a more realistic result of the real contamination level in the respective sample and therefore directly contributes to drug safety.
References
1. Drexler HG, Uphoff CC. Mycoplasma contamination of cell cultures: Incidence, sources, effects, detection, elimination, prevention. Cytotechnology. 2002;39(2):75-90. doi:10.1023/A:1022913015916. 2. Olarerin-George AO, Hogenesch JB. Assessing the prevalence of mycoplasma contamination in cell culture via a survey of NCBI’s RNA-seq archive. Nucleic Acids Research. 2015;43(5):2535-2542. doi:10.1093/nar/gkv136.